

Safety Assessment
|
Aleksandra Zuraw, DVM, PhD
AI in Non-Clinical Pathology
What AI-powered image-based analysis actually means for drug development teams
Artificial intelligence is changing how tissue tells its story.
In nonclinical drug development, pathologists have long been the primary interpreters of that story — examining stained tissue sections, identifying findings, assigning grades, and translating what they see into data that guides decisions about drug safety and efficacy. AI image analysis is meaningfully expanding what’s possible when a program needs more from its tissue data than a traditional read can provide.
The change is about adding a layer of quantitative precision that wasn’t previously accessible at scale — and making it available not just to the pathologist but to the entire cross-functional team.
Why Quantitative Data from Tissue Matters
Pathologists evaluate tissue using semi-quantitative scoring — an ordinal grading system that reflects expert judgment and has been the backbone of toxicologic pathology for decades. It works well, and it isn't going away. But ordinal grades have a structural limitation that matters for drug development: they are not continuous data. They describe a finding in terms of severity — minimal, mild, moderate, marked, severe — but they don't readily translate into the kind of quantitative output that statisticians can model, study directors can compare across groups, or drug development scientists can use to make fine-grained go/no-go decisions.
AI-powered image analysis fills that gap — not by replacing the pathologist’s evaluation, but by adding a quantitative dimension alongside it. When a program needs to measure subtle morphometric changes across an entire tissue section, count specific cell populations with precision, or generate data points suitable for standard statistical tests, image analysis delivers what visual scoring alone cannot. Pathology data becomes more useful to more people across the program.
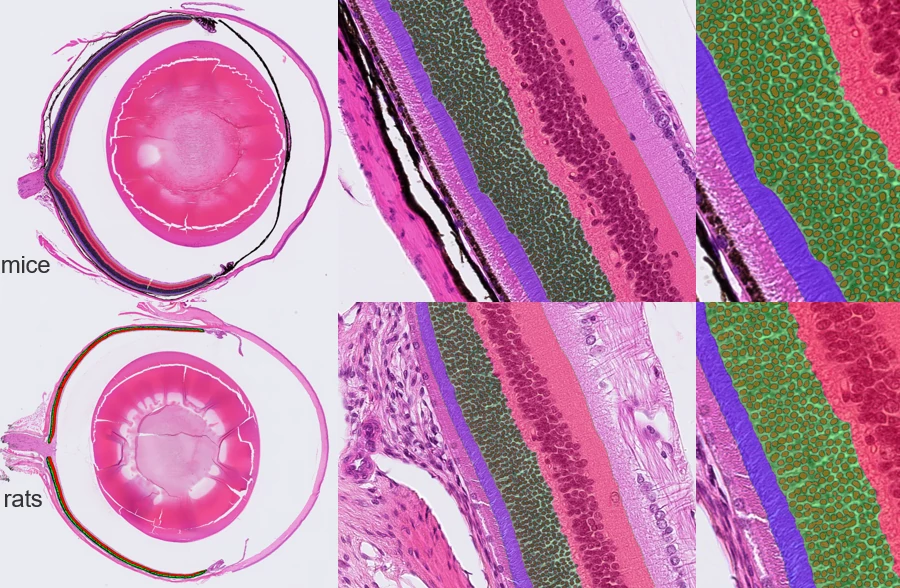
Image 2: A blue-light-induced retinal damage model used to study retinal atrophy in rodents. AI-powered image analysis can help segment (in yellow) the remaining cell nuclei present in the Outer Nuclear Layer (ONL) in order to quantify their decrease. The same neural network works for both mouse and rat retinas -- Image courtesy of Charles River, Senneville
How AI Is Applied Differently Across Study Types
The role of AI-powered image analysis depends significantly on where it is applied within the development program.
In discovery and efficacy models, it can function as the primary readout, effectively replacing semi-quantitative scoring with objective, statistically analyzable data. This works particularly well when a disease model is well-characterized, study designs are repeatable, and the scientific question calls for group comparisons with statistical rigor.
Scientists at Charles River Senneville have put this into practice across several inflammation models. For a dextran sodium sulfate-induced colitis model — a standard tool for ulcerative colitis drug screening — an AI algorithm trained to quantify diseased mucosa across whole colon sections (Bédard, 2021) showed strong correlation with pathologist scoring and held that performance across multiple subsequent studies without retraining. A parallel effort in skin inflammation models used for psoriasis and atopic dermatitis research produced similar results: AI quantification of tissue compartments — epidermis, dermis, and inflammatory infiltrate — was consistent with expert evaluation and generated data amenable to standard statistical analysis. In a retinal damage model used to screen neuroprotective candidates, AI-based quantification of outer nuclear layer nuclei was consistent with both in-life imaging measurements and manual pathologist counts across a range of damage severity (Lohr, 2021). Once developed, these algorithms supported multiple studies and can be deployed immediately, saving time for future studies—a practical advantage for programs running repeated model experiments.
In discovery settings, the bottom line is clear: for well-characterized models, AI image analysis delivers quantitative data that supports sharper statistical comparisons and faster decisions. In toxicology studies, AI plays two distinct but complementary roles in both GLP- and non-GLP-compliant settings.
The first is decision support. Working with a digital pathology partner, Charles River has developed an AI tool that incorporates organ-based lesion classifiers built from an extensive database of non-clinical pathology images. Embedded directly into the digital review workflow alongside whole slide images, it surfaces relevant findings across key tissues during primary evaluation and peer review — improving consistency and efficiency at the point of evaluation.
The second application is quantification as a study endpoint — where image analysis generates continuous, reportable data that sits alongside traditional pathology findings in the study output. As described by Zuraw, Staup, and colleagues in Toxicologic Pathology (2021), qualified image analysis algorithms can produce cell counts, area measurements, density ratios, and morphometric parameters that meet regulatory expectations for reported data and can be submitted to standard statistical analyses. In neuropathology, for example, automated G-ratio analysis measures every detectable myelinated axon in a section — capturing inner and outer diameters, axon area, and myelin sheath area — at a scale and reproducibility that manual measurement cannot match. It adds a quantitative data stream that enhances the value pathology delivers to the program.
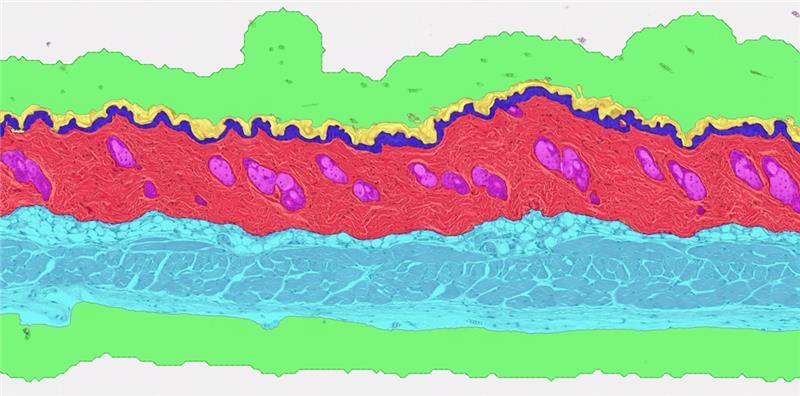
Image 3: AI segmentation of dorsal skin from a healthy mouse from a control group. The AI-powered image analysis provides a clear contrast between the dermis, epidermis, keratin layer, and glands/hair follicles. -- Image courtesy of Charles River, Senneville
Biomarkers, Multiplex Panels, and Spatial Data
The same principles apply to immunohistochemistry (IHC) biomarker quantification, where AI-powered image analysis has become increasingly central to drug development workflows. Automated quantification of Ki-67 as a proliferation index, enumeration of CD3+ and CD8+ immune cell populations, and characterization of immune infiltration across tissue compartments are among the most established applications. According to a white paper from the Digital Pathology Association, image analysis-based quantification of these markers produces objective, reproducible metrics that inform decisions across safety evaluation, target expression and validation, and pharmacodynamic assessment — data that visual estimation cannot provide with the same consistency.
Multiplex immunofluorescence takes this further. By simultaneously characterizing multiple markers on a single tissue section while preserving spatial relationships, it allows co-expression patterns and cell-cell proximities to be quantified rather than estimated. For immuno-oncology programs where understanding the tumor immune microenvironment is scientifically critical, this level of spatial quantitative data opens questions that single-plex visual scoring cannot approach. Society for Immunotherapy of Cancer guidelines describe validated multiplex workflows in which quantitative spatial analysis has contributed to biomarker discovery and therapeutic stratification strategies.
The Infrastructure Behind It
None of this is theoretical. Applying AI-powered image analysis in a regulated drug development context requires a validated digital pathology infrastructure — and that foundation is in place at Charles River. More than 300 GLP toxicology studies have been completed using whole slide images (WSI), and more than 45 regulatory submissions have included WSI-generated pathology data. AI-powered image analysis operates within this same validated environment, with algorithms subject to qualification and verification processes consistent with regulatory expectations.
The tools are validated. The science is established. For pharmaceutical and biotech programs generating tissue data across discovery, safety assessment, and translational research, AI-powered image analysis in non-clinical pathology is how that data works harder — for the pathologist, and for everyone else on the team.
Figure 1: The two images shown at the top of this story depict the same diseased mucosal tissue in a rodent model used to study inflammatory bowel disease, particularly ulcerative colitis. The image on the right shows how AI-powered image analysis can reveal the deeper contrast between partially recovered diseased mucosa (in red) and normal mucosa (in blue). -- Image courtesy of Charles River, Senneville
References:
1. Haydee, L., et al. Appl Immunohistochem Mol Morphol Aug 1;29(7):479-493. 2021 doi: 10.1097/PAI.0000000000000930. PMID: 33734106; PMCID: PMC8354563.
2. Sater S, J Immunother Cancer. Dec 21;13(12):e012280 2025. doi: 10.1136/jitc-2025-012280. PMID: 41423269; PMCID: PMC12718562.
3. Bédard A, Westerling-Bui T, Zuraw A. Proof of Concept for a Deep Learning Algorithm for Identification and Quantification of Key Microscopic Features in the Murine Model of DSS-Induced Colitis. Toxicol Pathol. 2021 Jun;49(4):897-904. doi: 10.1177/0192623320987804. Epub 2021 Feb 12. PMID: 33576323.
4. Lohr, J. Development of a deep learning model for quantification of retinal atrophy in a rat model of
blue light-induced retinal damage. CV Lohr, T lejeune, V Piccicuto, L Smith, A Zuraw. Poster, STP 2021.
5. Zuraw, A et al. Toxicol Pathol. 2021, Jun; 49 (4) 773-784; doi: 10.1177/0192623320980310. Epub 2020 Dec 29.