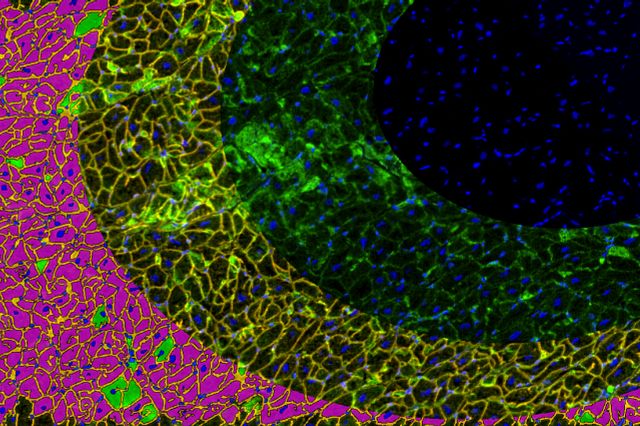
AI-Assisted Digital Pathology Image Analysis Services for Discovery and Safety Assessment
With the advent of deep learning for computer vision, we can now generate numerical endpoints using digital image analysis (DIA) with greater precision than ever before.
The adaptive nature of artificial intelligence (AI) technologies, such as convolutional neural networks (CNNs), has created new challenges for regulatory agencies. But, with cooperative input from Charles River scientists and pathologists across the globe, responsiveness of the developers of AI-assisted image analysis platforms, and published guidelines from the FDA, we have developed a method of phenomenological “black box” verification testing, which allows us to generate GLP-compliant algorithms for digital image analysis of pathology endpoints.
Advance Your Translational Research with High-Plex Spatial Profiling
This webinar will help you reveal deeper biological insights that accelerate decisions. Discover high‑plex spatial profiling and how it strengthens your translational research.
Watch Now
Advantages of CNN-assisted Digital Image Analysis
- Automated versus manual collection of quantitative data, freeing up resources
- Can accommodate greater quantities of study material
- Time savings
Our experienced scientists can discuss endpoint-specific options and guide study and protocol design for the most appropriate fixation, collection, and sampling techniques to ensure the highest quality and most accurate, unbiased data.
What are the steps?

Discuss With Our Experts
Our scientific staff will review your study’s unique needs and work with you to tailor the right approach to measure the necessary endpoints.

Submit Your Materials
Send us what you have; we can meet you wherever you are. Upload your digital images to our secure portal. Don’t have images yet? Send us your slides, we offer a variety of slide scanning magnifications and options. Need slides made? We can help you with that too.

Image Analysis
From algorithm development and optimization to data generation and statistical analysis, we perform world class image analysis services customized to meet your particular needs, for both regulatory and investigative research purposes.

Reporting
We address all your project needs including comprehensive report materials, methods description, results, and more. and more as dictated by your image analysis project needs.
In collaboration with Charles River Laboratories, we look forward to bringing Patholytix Foresight to the forefront of digital pathology, empowering pathologists worldwide with cutting-edge AI technology for more efficient and accurate toxicological assessments. This advance is part of our collective vision to enable AI-empowered and regulated digital primary review of safety studies.”
Pierre Moulin, PhD, MBA, Chief Scientific Officer, Deciphex
Examples of Pathology Image Analysis Services and Expertise
Beyond the examples listed here, our image analysis experts are ready to help you with a wide range of quantitative measurements for your program, bespoke to your particular needs.
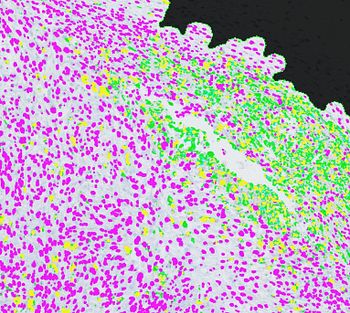
- Quantitative analysis of in situ hybridization images to characterize DNA or RNA expression in tissues, providing robust spatial transcriptomics data
- Static and dynamic measurements for Musculoskeletal Pathology
- Small intestine villus length, crypt depth, and villus/crypt ratios
- Image analysis of immunohistochemically or histochemically stained slides, including number of labeled cells, area of positive staining, and tissue composition analysis
- Determination of cell proliferation index (Ki67, BrdU, PCNA) or apoptotic index (cleaved caspase-3, TUNEL)
- Diameter of stented blood vessels for Medical Device Pathology
- Extent of infarcts in the heart
- Capillary angiogenesis in cutaneous wound defects, including microvascular density quantification
- Goblet cell number in the respiratory tract
- Adult and juvenile rat cerebellar and cerebral measurements for Neuropathology
- Axon and nerve fiber changes in peripheral nerves
- Skeletal muscle characterization
- Pulmonary fibrosis assessment
- Assessment of efficacy of compounds in preclinical models for various diseases (blue light induced retinal atrophy, DSS colitis, imiquimod model, etc.).
- Thyroid gland epithelial height and colloid area for endocrine disruptor assessment
- Biodistribution in the context of gene and cell therapy:
- Detection and quantification of Vector DNA, therapeutic mRNAs using ISH techniques, chromogenic or fluorescence, multiplexing possible (comparison of vectors for example)
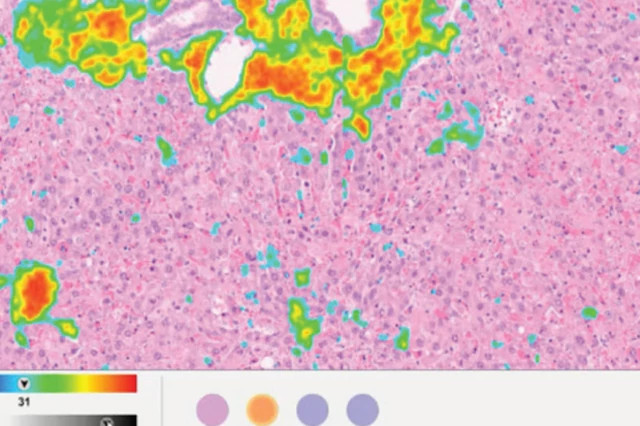
Webinar: Digital Pathology and Image Analysis
Discover the evolution of digital pathology solutions and image analysis, current applications, and future advancements in this expert-led webinar discussion.
Watch Now
Tumoral microenvironment investigation in clinical human samples to address the following questions:
- Is the tumor “hot” or “cold”?
- What are the immune cells infiltrating the tumor?
- Are tumor cells proliferating?
- Are lymphocytes activated? Exhausted? What about the regulatory T cells?
- Where are the TAMs within the tumor? Macrophage polarization?
- Spatial immunophenotyping
Immunophenotyping and quantification of subset of immune cells in tissue sections from preclinical species, to investigate immunomodulatory effects with a morphological context. Complementary to flow cytometry.
Capabilities
- Paraffin, plastic, and frozen embedding
- Histochemical, immunohistochemical, and immunofluorescence staining for endpoints of interest
- Versatile platforms (Roche Ventana instruments, Leica Bond Rx; access to state-of-the art reagents, including barcoded antibodies
- Brightfield and fluorescent whole slide scanning (including S360 and S60 from Hamamatsu, GT450 from Leica, Axioscan from Zeiss, PhenoImager from Akoya)
- Software analysis of whole slide digital images (Visiopharm on several sites, GLP-compliant in DUR, EDI, and EVR)
- Ultrastructural analysis with transmission electron microscopy
Applications
- Neuronal analysis for neurodegenerative disease research
- Sensory and sympathetic neuronal toxicity evaluation
- Intra-epidermal nerve fiber length or density estimates
- Alveolar assessments in animal models of lung disease
- Bone surface area and osteoblast quantification in osteoporosis models
- Pancreatic cell evaluations for diabetes research
- Glomerular function assessment for diabetic nephropathy
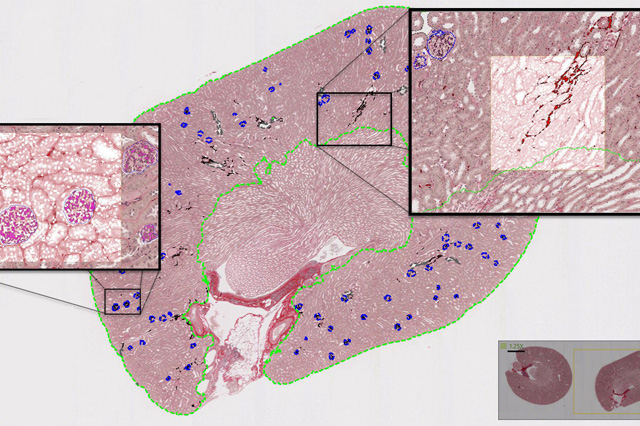
Figure 1: Picrosirius Red-stained kidney. A CNN was trained to segment the cortex from the medulla (excluding vessels), and segment the glomeruli within the cortex.
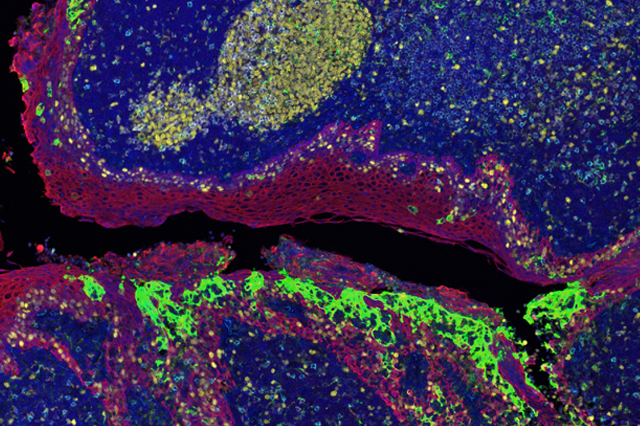
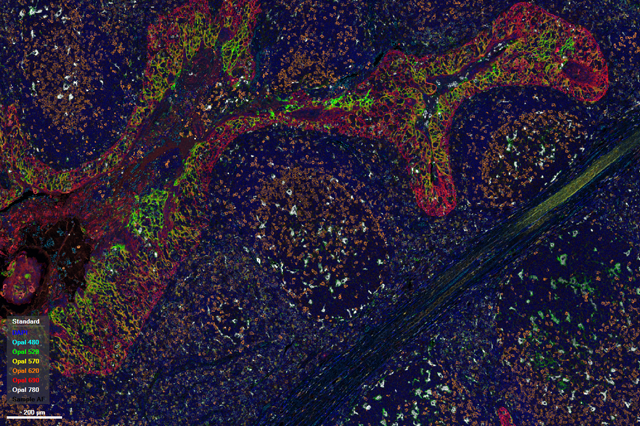
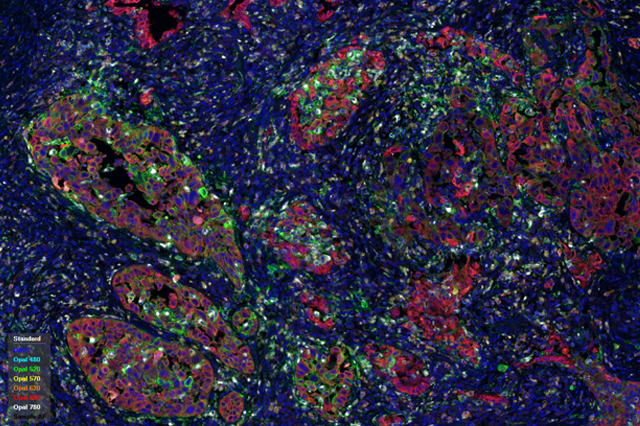
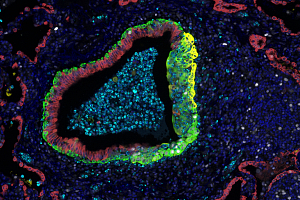
Figure 2: 6-plex fluorescence immunophenotyping (CD8, PDL1, FOXP3, CD68, PanCK, PD1) in human tonsil and lung tissue.

Controlling Quality of Automated Image Analysis
In this webinar, learn how human pathology experts are at the core of digital platform success, helping to avoid workup bias and ensuring the quality of artificial intelligence outcomes.
Watch the Webinar
Our image analysis experts are ready to help you with a wide range of quantitative measurements for your program.
Frequently Asked Questions (FAQs) About Image Analysis
-
What is digital image analysis?
Digital tissue image analysis is a computational method for analyzing whole-slide images and extracting large, complex, and quantitative data sets.
-
Does artificial intelligence improve the accuracy of Digital quantitative image analysis?
AI improves the precision of image analysis services by offering greater consistency than manual scoring, reducing variability around the mean, which can improve the ability to detect more subtle differences between groups.