
Assessment of in vitro anti-tumor efficacy of developmental agents of tumor panel screens
Human tumor cell lines developed from primary tumor material or patient-derived xenografts (PDX) continue to be a valuable tool for anti-cancer research. Tumor panel screens are offered to assess the efficacy of drug candidate compounds to inhibit tumor cell growth in single-agent or matrix combination layouts and to investigate if anti-tumor activity is selective for different histologies or dependent on molecular markers. 2D tumor panel screens can be executed with predefined standard panels, covering a diverse set of histologies—among them the most frequently observed in clinic—or using customized tumor panels, which are compiled based on the expression of distinct molecular markers, all picked from a comprehensive collection of over 440 human tumor cell lines (Figure 1). Proliferation endpoint measurement is routinely performed using CellTiter-Glo®, propidium iodide, CyQUANT™, CellTox™ Green, or CellTiter-Blue® assay readouts (further readouts established and available upon request).
CellTiter-Glo® and CellTiter-Blue® cell viability assays are homogeneous methods to determine the amount of viable cells in culture based on the ability of living cells to convert a redox dye (resazurin) into a fluorescent end product (resorufin) or on quantitation of the ATP present in metabolically active cells, respectively. The propidium iodide assay is a multistep assay, where the DNA of vital tumor cells is stained as a correlate for cell number.
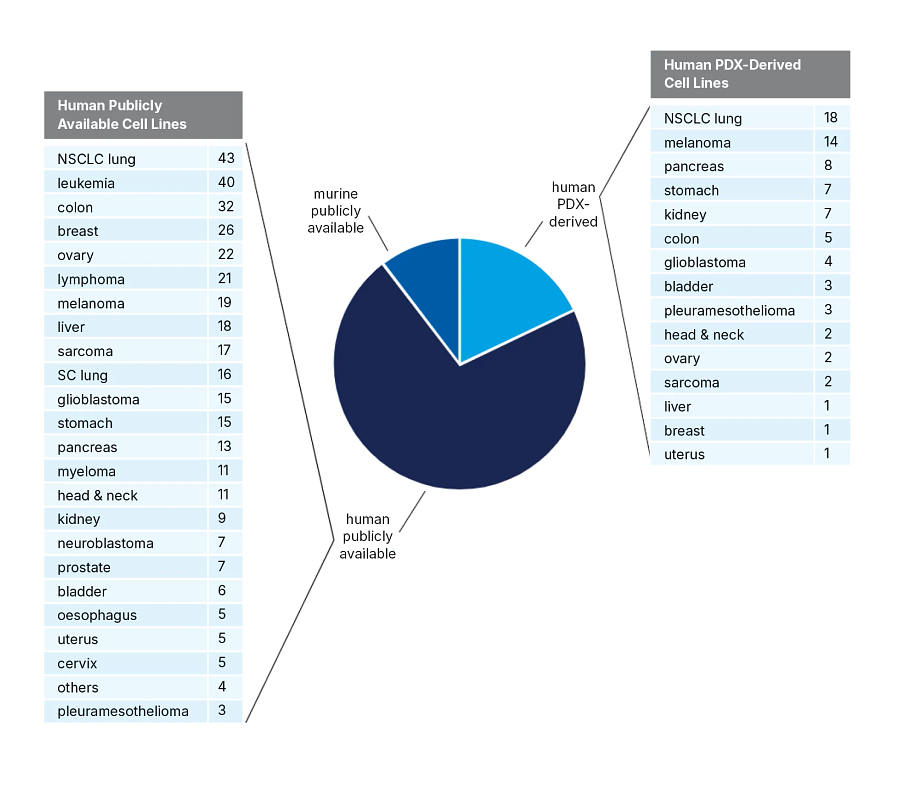
Figure 1. Cell line collection is available for 2D cell culture assays.
Panel Screens Assay Principle
Tumor cells are harvested from exponentially growing cultures and plated in 96-well flat-bottom microtiter plates at a cell density of 4,000 to 20,000 cells/well, dependent on the cell line’s growth rate, to get a 70-80% confluency at the end of the culture time. After a 24-hour recovery period, to allow the cells to resume exponential growth, drug candidates and controls are added. After another 2 to 4 days of incubation, the number of vital cells or viability of the cells is measured by CellTiter-Glo®, propidium iodide, or CellTiter-Blue® as fluorescence or luminescence signal using an EnVision™ or EnSpire™ plate reader. Single-agent efficacy is reported as relative or absolute IC50 or IC70 value derived from up to 10-point concentration-effect curves. Matrix combinations are evaluated based on Bliss independence analysis.
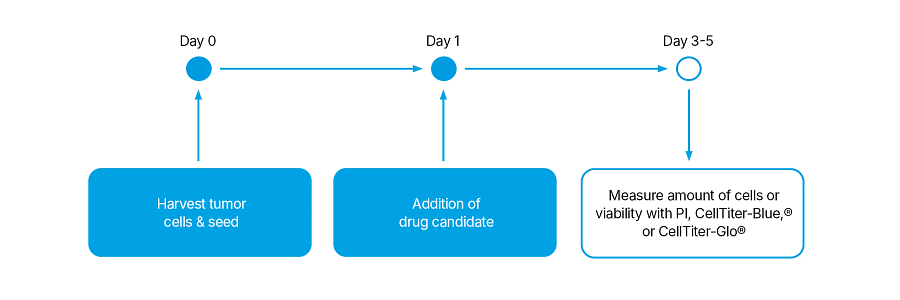
| Assay Setup | |
|---|---|
| Cells | PDX-derived and/or publicly available cell lines |
| Seeding density | 4×10³ - 2×10⁴ cells/well (96-well format) |
| Incubation | 3–5 days after seeding, 2–4 days exposure to drug candidates |
| Readout | CellTiter-Glo®, Propidium iodide (PI), or CellTiter-Blue® |
2D Cell Culture Assay Performance
The representative graphs below show good assay reproducibility in panel screens for targeted and cytotoxic agents (Figure 2).
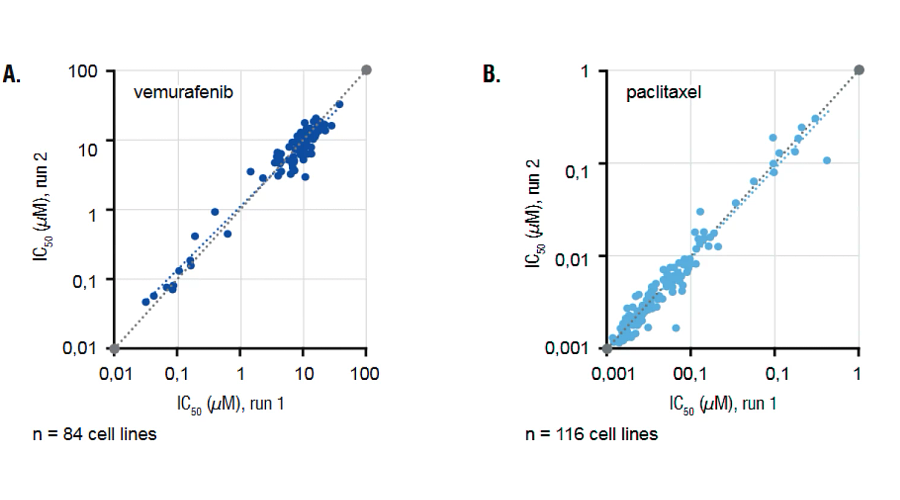
Figure 2. Reproducibility of IC50 determinations in human tumor panels of, e.g., A) vemurafenib in 84 cell lines, and B) paclitaxel in 116 cell lines
Single Agent Efficacy Screens
The response of 42 tumor cell lines toward over 300 reference compounds is shown below. IC50 values obtained for all cell lines are normalized to their mean across the panel with a color code ranging from green (low IC50, sensitive cell line) to red (high IC50, resistant cell line). Thus, the differential activity of a compound can be displayed on a high level. Moreover, the IC50 patterns are characteristic of different modes of action, meaning that the IC50 pattern of compounds with the same mode of action cluster closely. Vice versa, the IC50 pattern of compounds with unknown modes of action can be correlated to the reference data set for hypothesis generation purposes (Figure 3).
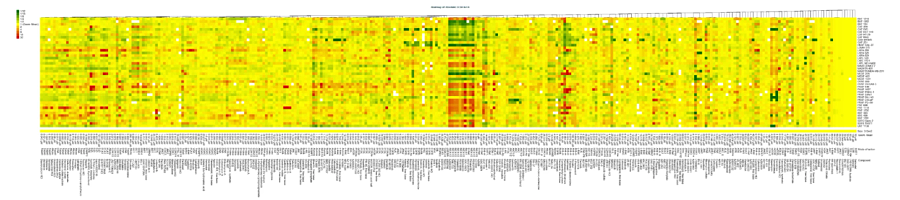
Figure 3. Response heatmap with absolute IC50 values obtained in single-agent efficacy screens using 2D cell culture assays
2D Cell Culture Matrix Combinations
The combination of MEK and PI3K inhibitors shows synergistic effects towards KRAS and PIK3CA double mutant DLD-1 cells, which confirms observation in literature (Temraz et al. Int. J. Mol. Sci. 16, 22976-22988, 2015; Haagensen et al. Brit. J. Cancer 106, 1386-1394, 2012). Bliss independence analysis showed that the combination of pimasertib (MEK1/2) and XL- 765 (PI3K/mTOR) was synergistic in 2D cell culture assays at mid to high concentration levels when tested up to 10 μM (Figure 4).
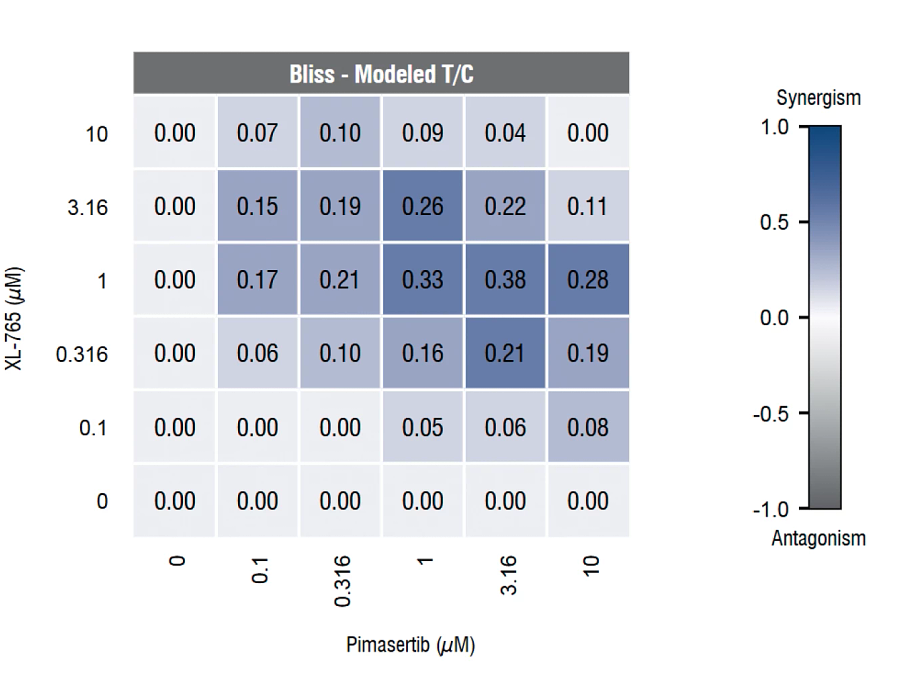
Figure 4. Bliss independence analysis of pimasertib (MEK1/2) combined with XL-765 (PI3K/mTOR) in DLD-1 cells.
Tumor panel screens represent time- and cost-effective tools in the earliest stages of research to characterize developmental compounds for anti-cancer efficacy and selectivity to determine candidate tumor models for subsequent in vivo studies or to support biomarker identification via bioinformatics approaches. Charles River has developed a collection of more than 75 proprietary human tumor cell lines derived from PDX material with low and well-controlled passage numbers, which guarantees that the cell lines retain the characteristics of the original tumor. For these cell lines, the original PDX model, which was never cultured in vitro, is available for subsequent in vivo follow-up studies. This set of PDX-derived cell lines is completed by a collection of about 370 publicly available human tumor cell lines. At Charles River, tumor panel screens using 2D cell culture assays can be executed with well-characterized, low passage PDX-derived and/or publicly available cell lines in predefined standard panels or by using customized tumor panels.