
Ex Vivo Analysis: T Cell Transfer Colitis Model
The inflammatory bowel diseases (IBDs) of Crohn’s disease & ulcerative colitis are idiopathic chronic inflammatory disorders of the intestine and/or colon. No single animal model completely recapitulates the clinical and histopathological characteristics of human IBD, but the following components are required to model human disease:
- Chronic gut inflammation largely mediated by T lymphocytes (T cells)
- Presence of commensal enteric bacteria, required for the initiation and perpetuation of intestinal and/ or colonic inflammation
- The genetic background of the animal represents an important modulator/modifier of disease onset and severity1
To identify and test novel therapies targeted at regulating the immunological mechanisms responsible for the induction, perpetuation, and/or regulation of IBD as well as the role of T-regulatory cells (Treg), T cell-dependent models of IBD are significantly more relevant to human disease than are the erosive, chemically-induced self-limiting models of acute colitis. Adoptive transfer of CD4+CD45RBhigh T cells (naive T cells, depleted of the Treg population) from healthy wild-type (WT) mice into syngeneic recipients that lack T and B cells induces a pancolitis and small bowel inflammation at 5-8 weeks following T cell transfer2-7
T Cell Transfer Colitis Model Assay Principle
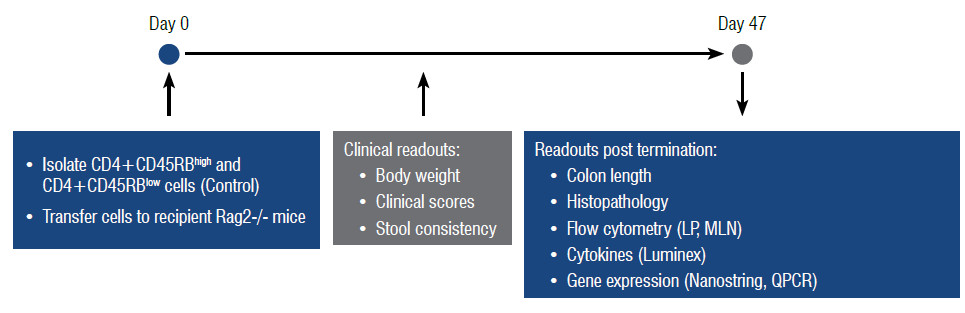
Naïve CD4+ T cells from C57Bl/6 are enriched by MACS® sorting (Miltenyi Biotec) and FACS sorted based on CD45RB using FACSAria™ Fusion. These CD4+CD45RBhigh cells are then transferred into RAG KO mice on Day 0. CD4+CD45RBlow T cells serve as experimental controls (Figure 1). Abatacept (CTLA4-Fc) is included as a drug control.
Table 1: Assay Workflow
Speak To An Expert
In Vivo Readouts - Clinical Observations and Scores
From Day 0, animals are monitored daily for non-specific clinical signs and weighed regularly. From 3 weeks post adoptive transfer until the end of the experiment, animals are monitored daily for clinical signs (including bodyweight loss, loose stools and clinical scores). A scoring system (max. score =12) is used, and both raw and analyzed data is provided (Figure 1).
-
Figure 1
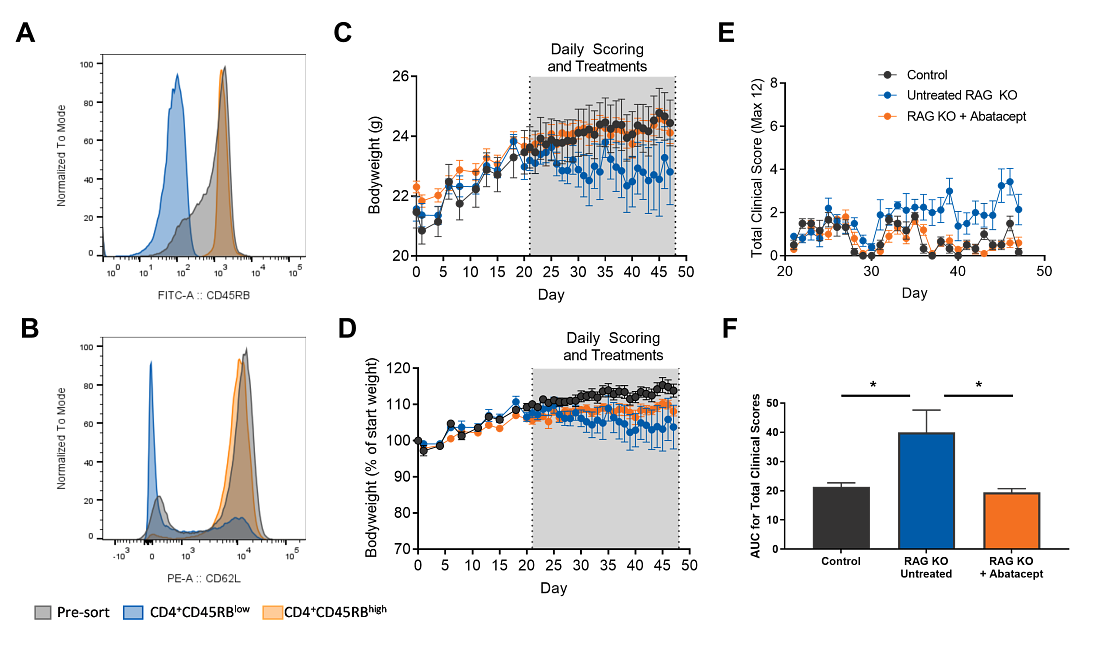
Figure 1. Pre-transfer T cell purity and clinical read-outs. (A+B) Cells were stained with CD4, CD45RB and CD62L and FACS sorted into CD4+CD45RB low and CD4+CD45RB high populations. (A) Purity of pre-sorted (red histogram) and pre-transferred cells (orange and blue histograms). (B) CD62L expression within the pre-sorted cells (red histogram), CD4+CD45RB low (Orange histogram) and CD4+CD45RB high (Blue histogram) sorted subsets. (C)Bodyweight in grams and (D) as a percentage of start weight. Area highlighted in which clinical scoring and Abatacept administration began. (E) Total clinical score out of twelve indicated per group over time. (F) Area-under-curve (AUC) analysis of total clinical scores. Rag KO untreated is significantly different to other groups. Statistical analysis unpaired t-test, P<0.05.
Ex Vivo Readouts: Flow Cytometry
To determine the effect of a therapy on the cell populations within relevant tissues highly specific and sensitive, multiparameter flow cytometric analysis of individual cells can be carried out on cells from colon lamina propria, spleen, and lymph node tissue; single cell suspensions are prepared at end time point(s) and cell counts and percentages for each population of interest are determined (Figure 2, 3). Analysis of lineage markers determines the cell types present within the tissue and analysis of cytokine expression, effector molecule and transcription factor expression indicate whether a therapy has modulated immune cell function.
-
Figure 2
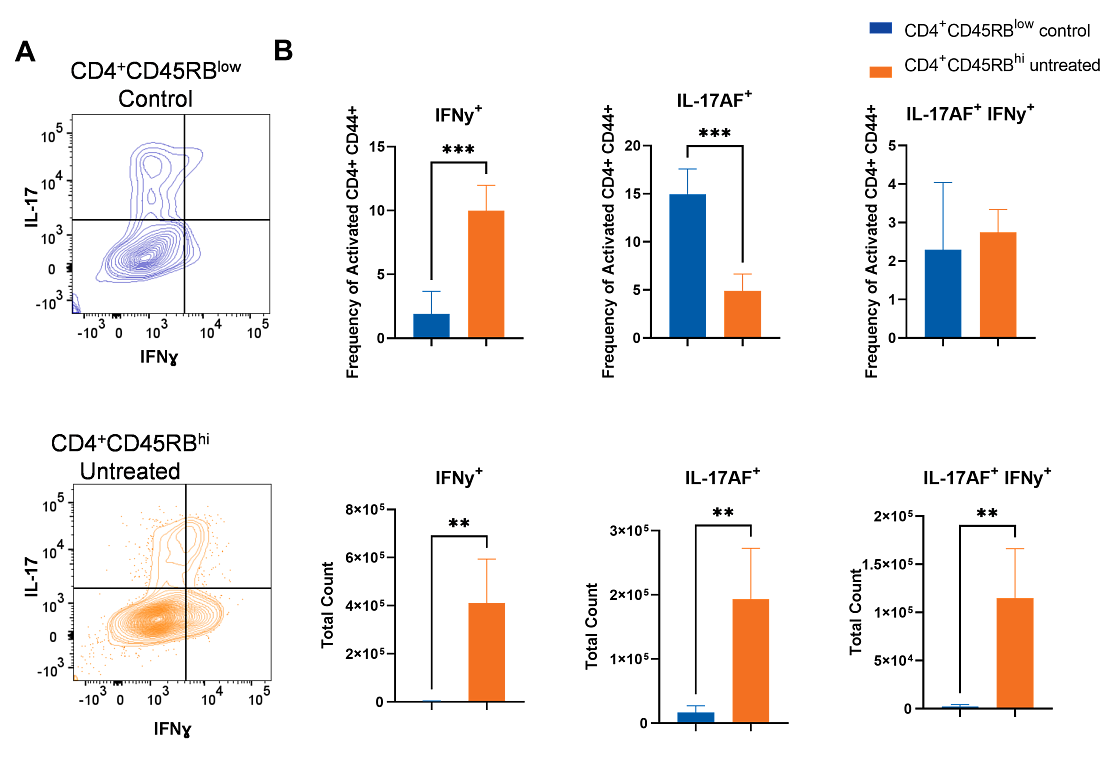
Figure 2. Phenotype of lamina propria immune cells after ex vivo re-stimulation. At day 49 post adoptive transfer, colonic lamina propria cells were dissociated and stained with a panel of markers. Representative flow cytometry for each group of mice showing: (A) IFNɣ versus IL-17, (B) frequency of IFNɣ/IL-17 producing CD4s or (C) total count of IFNɣ/IL-17 producing CD4s. **p<0.005, *** p<0.0005; two-tailed un-paired t-test.
-
Figure 3
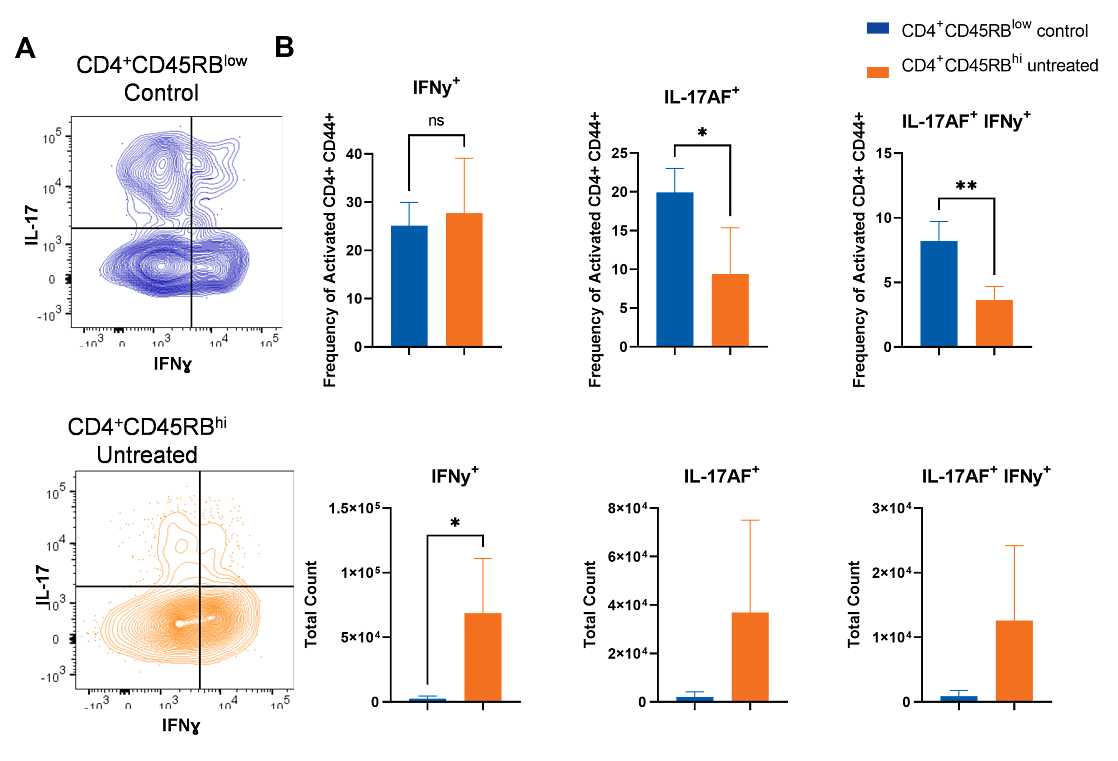
Figure 3. Phenotype of lymph node immune cells after ex vivo re-stimulation. At day 49 LN were processed to single cell suspensions and stained with a panel of markers. Representative flow cytometry plots for each group of mice showing: (A) IFNɣ versus IL-17, (B) frequency of IFNɣ/IL-17 producing CD4s or (C) total count of IFNɣ/IL-17 producing CD4s . *p<0.05; **p<0.005, two-tailed un-paired t-test.
Histopathology and T Cell Transfer Colitis Models
Histopathology can provide information on how a therapeutic limits immune driven pathology and damage of the gut barrier epithelial layer; At termination, ‘Swiss rolls’ of the colon can be processed for paraffin-embedding, sectioning and haematoxylin and eosin (H&E) staining. Sections will be scored by a qualified histopathologist according to a semiquantitative scoring system. Representative images will be provided. Figure 4 shows histology scores for mice receiving CD4+CD45RBhi cells (untreated) and those receiving CD4+CD45RBhi cells and Abatacept. Figure 4 also shows H&E staining from each group, illustrating the changes in tissue morphology and immune infiltration in the untreated versus Abatacept group. Overall, treatment with Abatacept inhibits immune infiltration and damage to the gut tissue.
-
Figure 4
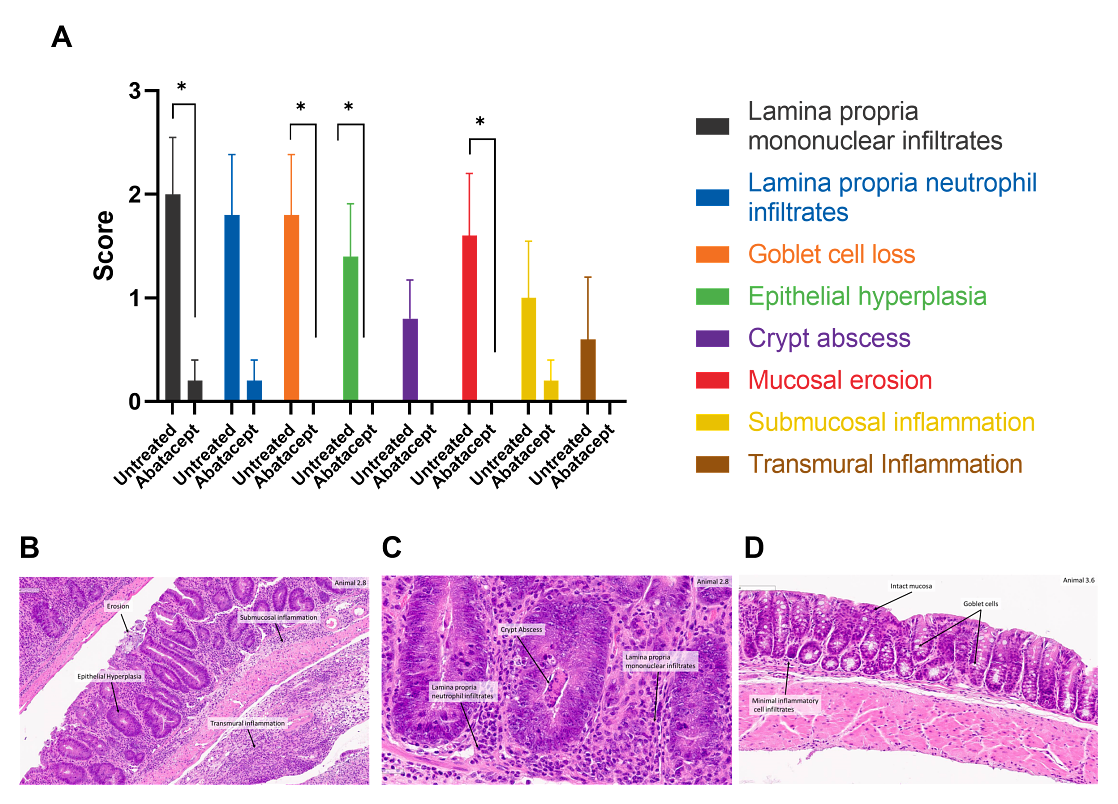
Figure 4: Colon histopathology. (A) Histopathological data are shown as mean scores ± SEM. Statistical analysis by unpaired non-parametric Mann-Whitney test. * indicates p<0.05 between the two groups for the criterion. Image (B) shows a histopathology section from a diseased animal, with examples of mucosal erosion, epithelial hyperplasia and submucosal and transmural inflammation. Scale bar: 100 μm. Image (C) shows illustrative histopathological data from a diseased animal showing crypt abscesses and lamina propria infiltrates of neutrophils and mononuclear cells. Scale bar: 50 μm. Image (D) shows data from a diseased, Abatacept treated animal, with evidence of a preventative/protective therapeutic effect, including intact mucosa, normal goblet cell numbers and minimal inflammatory cell infiltrates in the lamina propria. Scale bar: 100 μm.
Luminex®
Bio-Plex Multiplex Immunoassays can be performed from serum obtained from terminal bleeds or colon homogenates (for use with Bio-Plex Pro™ Mouse Cytokine Th17 panel, Th1/Th2 panel or custom panel).
NanoString Analysis
A piece of distal colon can be taken prior to histological sampling for NanoString analysis allowing measurement of gene expression within the tissue (up to 770 genes on either a prebuilt or custom gene panel such as the nCounter® Autoimmune Profiling Panel) and how gene expression is modulated by a therapy allowing identification of potential biomarkers and identification of potential MOA. Figure 5 shows NanoString analysis of RNA extracted from distal colon samples with a panel of 33 genes of interest and 5 housekeeping genes, compiled based on literature. The selected genes are associated with inflammation, cell adhesion, extracellular matrix, and angiogenesis. The results from the gene expression analysis show that the profile aligns with colitis pathological manifestations and complements the characterization of the model.
-
Figure 5
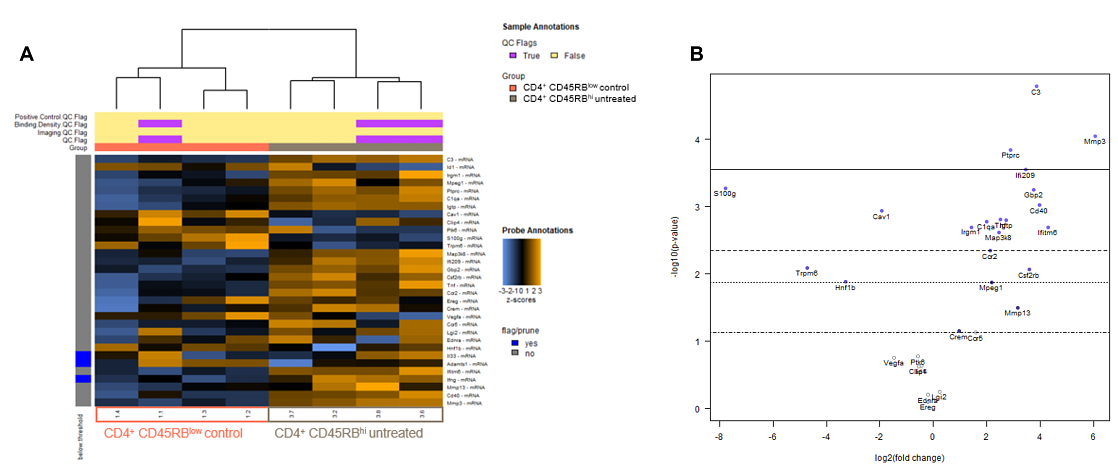
Figure 5: NanoString Analysis of RNA extracted from Distal Colon Samples. NanoString data was analysed using the advanced analysis module of the nSolver software. (A) Heatmaps of the normalized data for each individual sample were generated via unsupervised clustering. Orange indicates high expression; blue indicates low expression. Genes were pruned if the counts are below 2 x median negative control probe counts in >62.5% of samples (>5/8 samples). Manual inspection of QC flags indicated no apparent difference in control counts when compared with the rest of the samples. A positive Z-score indicates gene expression at a higher level than the mean, and a negative Z-score indicates gene expression at a lower level than the mean. (B) Differential analysis of CD4+ CD45RBhi untreated vs CD4+ CD45RBlow control. Volcano plots displaying each gene's -log10(p-value) and log2 fold change with the selected covariate. Highly statistically significant genes fall at the top of the plot above the horizontal lines, and highly differentially expressed genes fall to either side.
Summary of T Cell Transfer Model of Colitis
The T cell transfer model of colitis recapitulates the clinical pathology (colitis and small bowel inflammation) observed in human intestinal inflammatory diseases such as Crohn’s disease and ulcerative colitis1-3. Adoptive transfer of naïve CD4 T cells depleted of Treg (CD4+CD45RBhi) leads to colitis and the presence of activated (CD44+) T cells expressing the effector cytokines IL-17 and IFNγ in the colonic lamina propria and draining mesenteric lymph nodes. In contrast, in the control group transferred with CD4+CD45RBlow T cells which contain Treg cells, animals remain healthy and T cells are not activated in the lamina propria. Administration of a T cell immunomodulator (Abatacept) following transfer of the CD4+CD45RBhi cells acts as a positive control, demonstrating a decrease in T cell activation and effector cytokine expression and a concomitant decrease in clinical scores.
Histopathology of the distal colon obtained from mice with active disease in this T cell transfer colitis model reveals transmural inflammation, epithelial cell hyperplasia, polymorphonuclear leukocyte (PMN) and mononuclear leukocyte infiltration, crypt abscesses, and epithelial cell erosions, as is observed in human disease1. Furthermore, mice exhibited varying degrees of weight loss, loose stools, and diarrhea, like the human disease. However, the major advantages of this in vivo model compared to the chemically-induced models of colitis are that one can examine the very earliest immunological events associated with the induction of gut inflammation as well as the perpetuation of disease. In addition, this model draws parallels to human disease, as it is T cell driven whereas the chemically induced models of colitis are largely innate cell-driven.
Therefore, it is important to consider target of a therapeutic when selecting a model. This model is responsive to a variety of different immunological and antibiotic treatment protocols, as illustrated by the Abatacept control used in the data provided and other published data2,6,7.
-
References
- Ostanin DV et al. Am J Physiol Gastrointest Liver Physiol. 2009, 296(2): G135-146.
- Powrie F et al. Immunity. 1994, 1(7): 553-562.
- Steinbach EC et al. J Vis Exp 2015, 98: 52533.
- Powrie F. Immunity. 1995, 3(2): 171-174.
- Mottet C et al. J Immunol. 2003 170(8): 3939-3943.
- Powri F. Ann N Y Acad Sci. 2004 1029: 132-141.
- Liu Z et al. J Immunol. 2000, 164(11): 6005-6014.