
Complex Biology In Vitro Assays
The spheroid T Cell cytotoxicity assay is the next level of immuno-oncology assay for modeling the physiological tumor microenvironment that cannot be achieved in a 2D co-culture format. In this assay, A549 cells were transfected with IncuCyte® Nuclight Green Lentivirus reagent (EF-1 Alpha Promoter, Puromycin selection) to generate a stable cell line. The cells are grown in ultra-low attachment plates to enable spheroid formation and treated with activated T cells in the absence and presence of test compounds or therapeutic antibodies. This method utilizes the IncuCyte live-cell analysis system for image-based Brightfield (T cells) and fluorescence (cancer cells) within the Brightfield boundary of spheroid area measurements. The changes in green fluorescence intensity of the A549 cell spheroid can be used as a direct measure of compound or standard of care-induced T cell-mediated cytotoxicity. Identified cytokines can be future studied in vivo across an immunology platform.
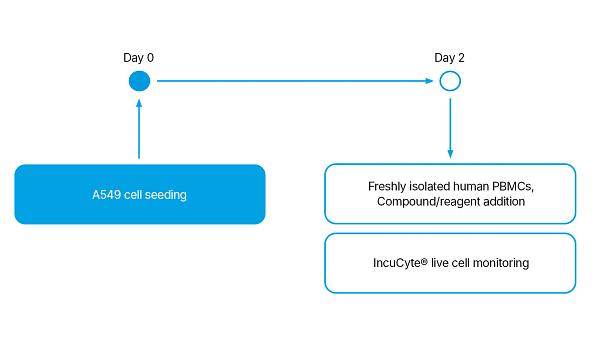
| 3D Spheroid T Cell Cytotoxicity Assay Setup | |
|---|---|
| Donor | PBMCs |
| Cell line | A549 cells stably expressing Nuclight Green reagent |
| Seeding density | 750 cells/well |
| Trigger (positive control) | 10 ng/mL anti-CD3 and 10ng/mL IL-2 |
| Cytotoxic control | 10μM staurosporine |
| Negative control | No trigger |
| Monitor | Scan every 4 hours |
| Readout | Phase Brightfield and Green; total green object area used for analysis |
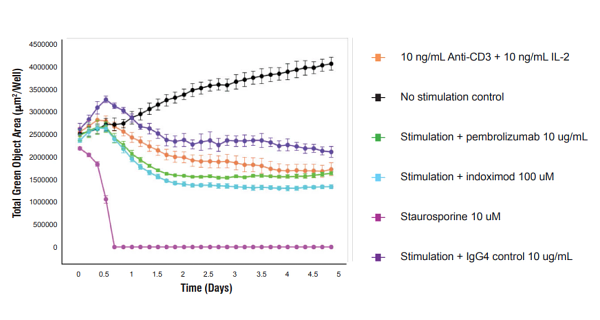
Representative data is shown below from one donor with 10 ng/mL anti-CD3 and 10 ng/mL IL-2 stimulation scanned every four hours post stimulation for five days.
Figure 1.
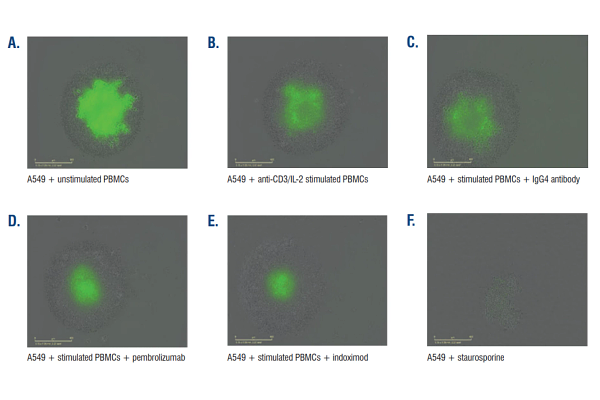
Figure 2.
The data is generated and analyzed with the IncuCyte® S3 Live-Cell Analysis System. The system automatically acquires images over time; the IncuCyte VesselView can be used to view images of all locations in the vessel at once and quickly assess experimental results, plus zoom in on images of interest. Multiple analysis parameters can be used to visualize the data and generate presentation-ready time-lapse graphs and movies.
A549 cells continue to proliferate in the presence of unstimulated human PBMCs; soluble anti-CD3 stimulation causes an increase in cancer cell killing.
Indoximod in the absence of anti-CD3 stimulation causes cancer cell killing to equivalent levels as anti-CD3 alone (data not shown). This is further enhanced in the presence of indoximod and anti-CD3 antibody stimulation. Pembrolizumab also shows an enhancement of the T cell-mediated cytotoxicity as compared to the IgG4 isotype control antibody.
3D Spheroid T Cell Cytotoxicity Assay Performance
Staurosporine is included as a positive cytotoxic control to show the maximal reduction possible in green fluorescence in the assay. Staurosporine is tested in the absence of any PBMCs.
A549 cells grown in the presence of unstimulated PBMCs are used as a negative control.
Therapeutic antibodies are compared to relevant IgG control antibodies for comparison.
Immune cell recognition and killing of unwanted target cells, such as emerging tumor cells, is a critical component of the human host defense mechanism. T cell-mediated killing and antibody-dependent cell-mediated cytotoxicty are two mechanisms of cell-mediated immune responses. Each of these processes involves the stimulation of specific immune cell subtypes, such as natural killer (NK) cells or cytotoxic T lymphocytes (CTL), which then actively lyse target cells. Understanding the interplay between the immune and cancer cells and restoring the immune system’s capacity to fight and eliminate tumor cells through immunotherapy is currently an exciting field of cancer research (immuno-oncology).
The ability to evaluate T cell-mediated tumor cell killing in a more physiologically relevant system that mimics the tumor microenvironment is highly desirable. Here we show an optimized immuno-oncology assay in which A549 target tumor cells are transfected with a fluorescent Nuclight lentiviral reagent which enables live cell imaging and monitoring over time. This is a stably transfected cell line so omits the time and resource requirement of labelling cells for each individual experiment. The A549 cells proliferate in ultra-low attachment plates and are allowed to form spheroids (Fig. 1).
Upon addition of human PBMCs at the ratio 1:10 in the absence of any stimulation, the human PBMCs do not induce tumor cell killing as shown by the bright green spheroid in Fig. 1A. Upon stimulation of the PBMCs with anti-CD3 and IL-2, there is a reduction in green fluorescence due to the induction of tumor cell killing (Fig. 1B).
Using this assay, changes in immunoreactivity (immune enhancement or immune suppression) by therapeutic antibodies, T cell therapies (CAR T cells) and small molecules to target tumor cells can be identified using isolated primary human PBMCs from our in-house donor panel. The live cell monitoring enables kinetics of the interactions between target and effector cells to be monitored.